Supplement
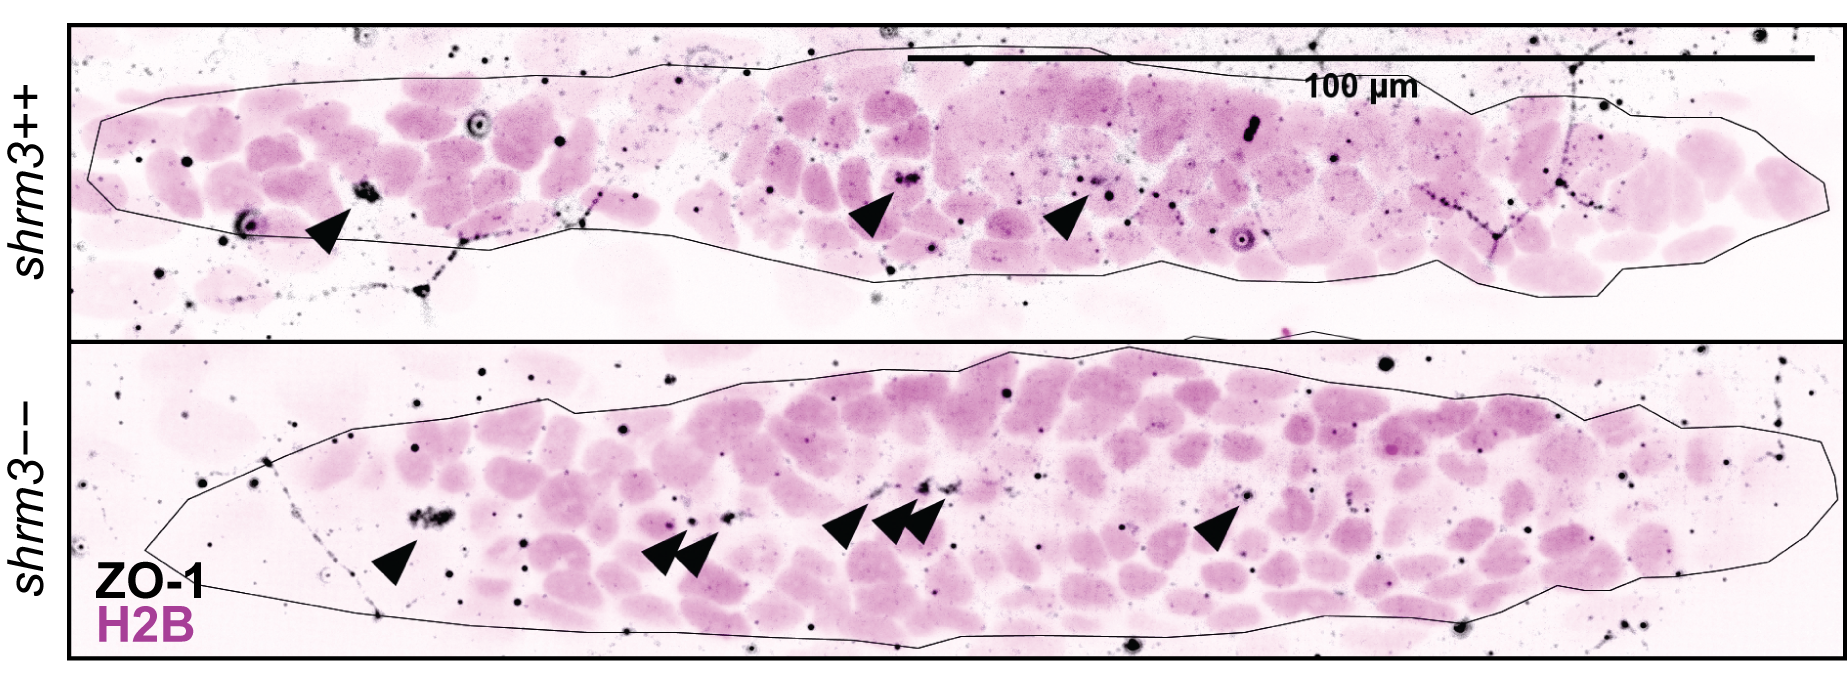
Figure 4.2: Luminal signaling. The pLLP is indicated by a dark line. Arrows indicate tight-junctions and possibly luminal structures on the apical side. Nuclei are visualized via a TgBAC(cxcr4b:H2B-RFP) transgenic line (section 2.1.7. ZO-1 is made visible via Immunostaining (section 2.1.3. Scalebar = 100 \(\mu\)m
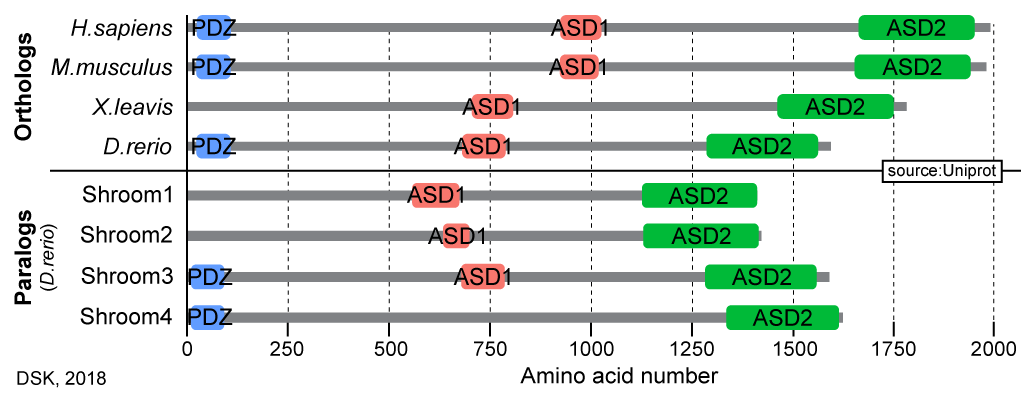
Figure 4.3: Shroom Ortho- and Paralogs. Groups on y-axis. Amino acid chain length indicated on x-axis. Data derived from Uniprot.